Curiosity drove me to learn more about how software development firms of different sizes vary financially, and whether or not there have been recent changes in our industry with respect to firm size. As I’ve previously described, the number of firms in NAICS code 541511 (custom computer programming services) follows a power law distribution when measured by annual revenue. This means there are a huge number of small firms and a handful of large firms. BizMiner sells reports of basic financial data according to industry, so I bought five reports for 541511 corresponding to my own arbitrary definition of size as measured by annual revenue. The table below shows how many firms are included in each of the revenue groups I selected.
| Group | Revenue Range ($) | No. of Firms | Mean Revenue ($) |
|---|---|---|---|
| Tiny | 0-0.5M | 2868 | 216,000 |
| Small | 0.5-1M | 594 | 690,700 |
| Medium | 2.5-5M | 215 | 3,480,200 |
| Large | 5-10M | 108 | 6,700,000 |
| Huge | 10-25M | 45 | 14,600,00 |
Is market share stable?
As the table below shows, each of the revenue groups accounts for approximately the same gross revenue (number of firms multiplied by the average revenue per firm) at around 20% of the total. Note: this data doesn’t correspond to the total size of the market, and hence isn’t actual market share, since I picked only a few revenue groups to evaluate.
The percentage of total gross revenue each group accounts for has been fairly stable over the last five years. It appears like the “shape” of our industry hasn’t changed much in recent years; each group is generating about the same percentage of the gross total revenue now as in 2005.
| 2005 | 2010 | |||
|---|---|---|---|---|
| group revenue ($) | share | group revenue ($) | share | |
| Tiny | 595M | 18.7% | 619M | 19.5% |
| Small | 427M | 13.5% | 410M | 12.9% |
| Medium | 747M | 23.5% | 657M | 23.6% |
| Large | 725M | 23.2% | 657M | 22.8% |
| Huge | 700M | 21.1% | 657M | 20.7% |
What about profitability?
From the perspective of efficiency, I would have expected the larger firms to have some advantages over the tiny and small firms, and for this to be reflected in profit margin (a more important metric than profit, I’ve argued). My selected BizMiner reports include EBITDA data, so I used it as the measure of profit and divided it by revenue to get an EBITDA profit margin.
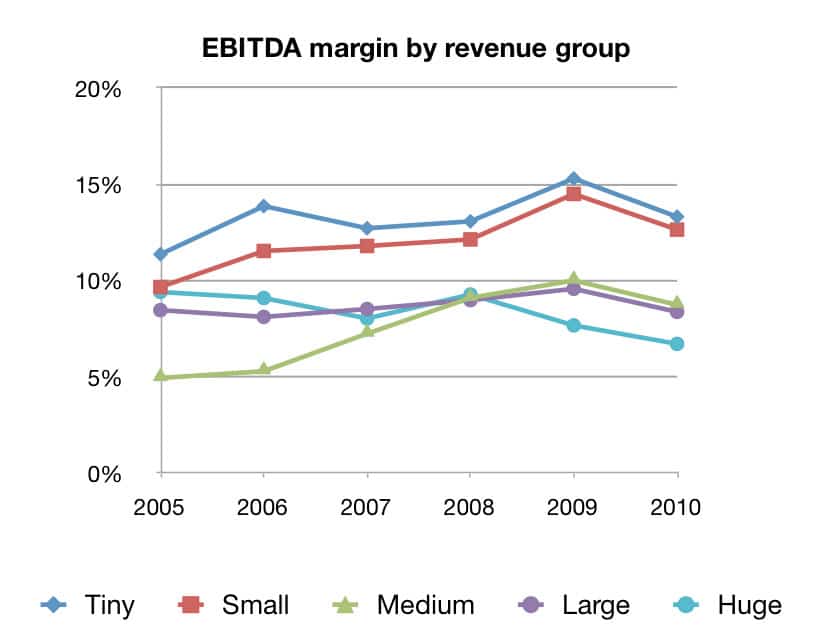
To my surprise, the BizMiner data shows the opposite of what I expected. For the revenue groups I defined, the bigger you are, the lower your margin. As the graph of profit margin by revenue group over the last five years shows, the performance of the medium group in 2005-2007 is the only exception to the “smaller is higher” rule.

The profitability of firms varies by their size. This relationship has been relatively stable over the last five years.
The table below gives the five year average margin for each group. It looks like as firms grow, their margin shrinks until it stabilizes in the 8% range.
| Group | Profit Margin |
|---|---|
| Tiny | 13.3% |
| Small | 12.0% |
| Medium | 7.6% |
| Large | 8.7% |
| Huge | 8.4% |
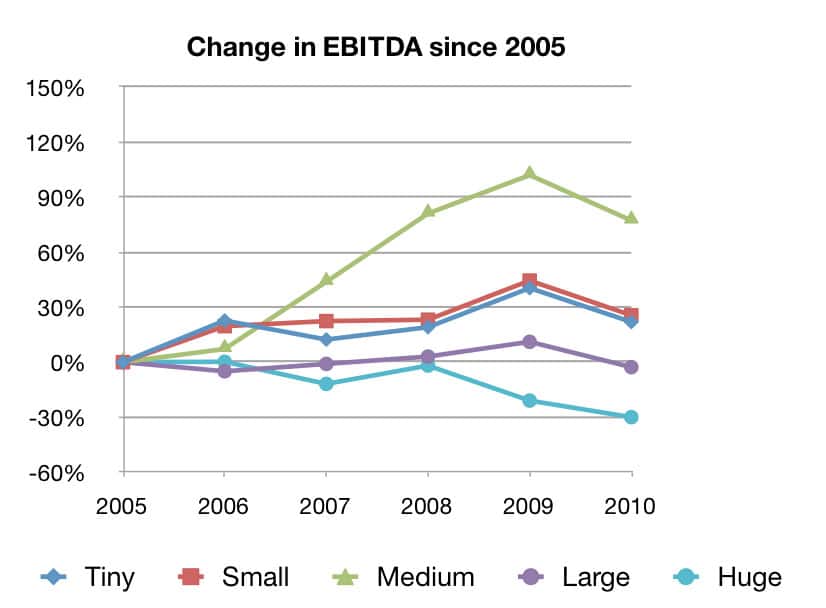
While 2010 was a bad year for firms of all sizes, smaller firms have seen significant growth in their margins over the past five years. By contrast, the profitability of huge firms is 30% lower than it was in 2005.

Change in EBITDA each year compared to the base of 2005. Smaller companies have become more profitable, larger companies less profitable.
Of course there are many possible explanations for weakening margins as firms grow. I suspect the firms who focus on growth for growth’s sake create this phenomenon. If, on the other hand, you keep the focus on being great, not big, then you should be able to grow while maintaining or even improving your profit margin.
The BizMiner reports I bought also include the typical P&L and balance statement information. What financial data are you curious about?
- Attention: Spending Your Most Valuable Currency - February 10, 2022
- Slicing the Revenue Pie in a Multi-Stakeholder Company - July 30, 2021
- Commercial versus Existential Purpose - July 19, 2021
- How I Misunderstood Mentorship and Benefited Anyway - June 16, 2021
- Sabbath Sundays and Slow Mondays - June 4, 2021