My goal with Great Not Big is to help people who build and run software development companies. Naturally, I wondered how many people would be interested in this topic. To figure this out, I tried to determine how many companies there were building custom software products as a service. As it turns out, we have an industry code that very closely aligns with what we do. The NAICS code of 541511 and the equivalent SIC code of 7371 are both called “custom computer programming services.”
According to the NAICS, reporting from US Census and Bureau of Labor Statistics data (I believe), there are 39,575 companies in the US that classify themselves in 541511. BizMiner reports a total of 46,428 companies in SIC 7371. My order-of-magnitude estimate about how many people are involved in building and running such companies is therefore 100,000.
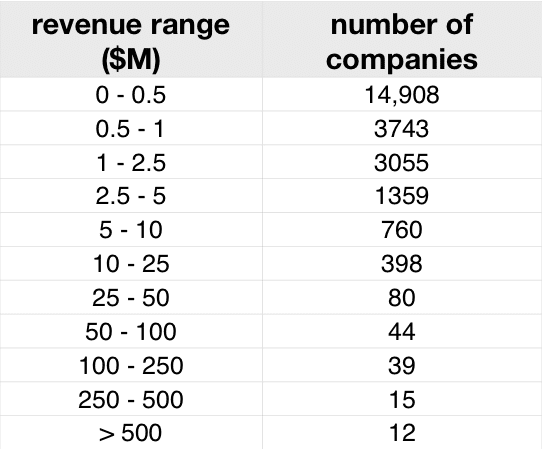
BizMiner has quite a lot of data on our kind of companies. One of the things you can find out without even buying one of their reports is how many companies fall into the various “revenue classes” they define in their Industry Financial Profiles. Here’s their count of companies by revenue for software development firms:
Of the 24,413 firms in the data above (this number differs from 46,428 because of how companies classify themselves, and the hierarchical nature of the classification scheme), the average revenue is $2,200,000. The gross revenue of all companies (calculated by multiplying the average revenue for each class by the count in that class) is $55.8 billion. That’s a drop in the bucket for the US GDP of $14 trillion, but not exactly an inconsequential number. And of course, if the fees paid to these companies are well-spent, then the total economic impact of what they produce is substantially larger.
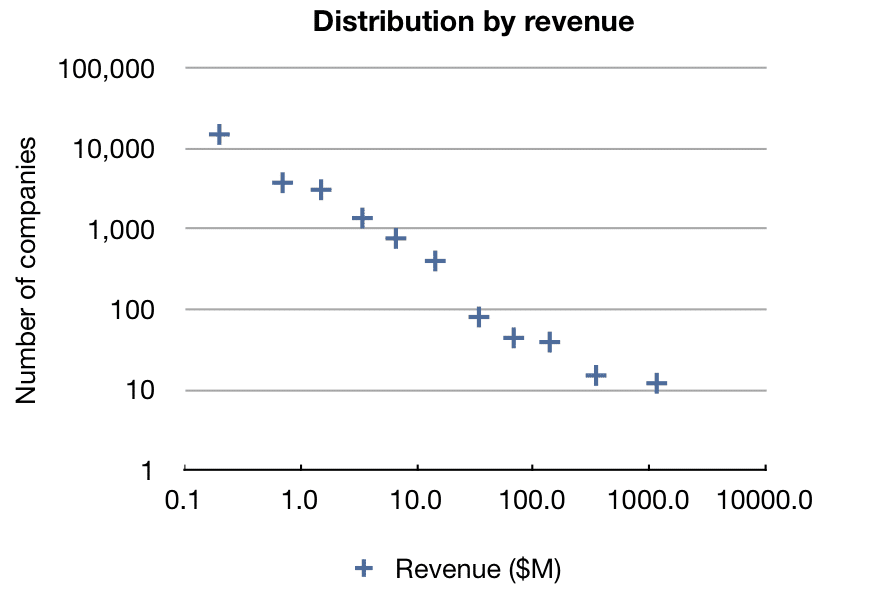
It’s pretty clear from eye-balling the data above that there are a whole lot of small companies in our segment and relatively few large ones. If you arranged buckets for different revenue ranges, and then you put each company in their respective bucket, how big would each bucket need to be? In other words, what’s the distribution of company size? When I played with the data, I came to the conclusion that company size follows a power law distribution. You can figure this out by plotting the count of companies in each bucket versus the average revenue for that bucket on a log-log graph, as below. The resulting straight line shows the power law relationship.
Another term you may have heard for power law is the Pareto distribution. When people say something follows the “80-20 rule” this is what they mean. The classical example of a Pareto distribution is wealth: 80% of a society’s wealth is held by 20% of its population. Other natural phenomenon that follow a power law distribution include the population of human settlements, the size of meteorites and sand grains, and the size of files transmitted by TCP. In the case of our industry, it’s actually closer to 85/15, as in 85% of the revenue is generated by 15% of the companies.
For the purposes of Great Not Big, the inverse view is more interesting to me: 85% of our companies have revenues of $1.2M or less.
- Attention: Spending Your Most Valuable Currency - February 10, 2022
- Slicing the Revenue Pie in a Multi-Stakeholder Company - July 30, 2021
- Commercial versus Existential Purpose - July 19, 2021
- How I Misunderstood Mentorship and Benefited Anyway - June 16, 2021
- Sabbath Sundays and Slow Mondays - June 4, 2021

